In this tutorial we will explore the Calinski-Harabasz index and its application to K-Means clustering evaluation in Python.
Table of Contents
Introduction
The Calinski-Harabasz index (CH) is one of the clustering algorithms evaluation measures. It is most commonly used to evaluate the goodness of split by a K-Means clustering algorithm for a given number of clusters.
We have previously discussed the Davies-Bouldin index and Dunn index, and Calinski-Harabasz index is yet another metric to evaluate the performance of clustering.
The Calinski-Harabasz index (also known as the Variance Ratio Criterion) is calculated as a ratio of the sum of inter-cluster dispersion and the sum of intra-cluster dispersion for all clusters (where the dispersion is the sum of squared distances).
What is Calinski-Harabasz index?
The Calinski-Harabasz index (also known as the Variance Ratio Criterion) is calculated as a ratio of the sum of inter-cluster dispersion and the sum of intra-cluster dispersion for all clusters (where the dispersion is the sum of squared distances).
How do you interpret Calinski-Harabasz index?
A high CH means better clustering since observations in each cluster are closer together (more dense), while clusters themselves are further away from each other (well separated).
In the next section the process of calculating the CH is described in detail with a few examples.
To continue following this tutorial we will need the following Python libraries: sklearn and matplotlib.
If you don’t have it installed, please open “Command Prompt” (on Windows) and install it using the following code:
pip install sklearn
pip install matplotlib
Calinski-Harabasz Index Explained
In this part we will go through each step of the calculations and provide meaningful illustrative examples to help better understand the formulas.
Step 1: Calculate inter-cluster dispersion
The first step is to calculate the inter-cluster dispersion or the between group sum of squares (BGSS).
The inter-cluster dispersion in CH measures the weighted sum of squared distances between the centroids of a clusters and the centroid of the whole dataset (barycenter).
The between group sum of squares is calculated as:
$$BGSS = \sum_{k=1}^{K} n_k \times ||C_k – C||^2$$
where:
- \(n_k\) : the number of observations in cluster \(k\)
- \(C_k\) : the centroid of cluster \(k\)
- \(C\) : the centroid of the dataset (barycenter)
- \(K\) : the number of clusters
Step 2: Calculate intra-cluster dispersion
The second step is to calculate the intra-cluster dispersion or the within group sum of squares (WGSS).
The intra-cluster dispersion in CH measures the sum of squared distances between each observation and the centroid of the same cluster.
For each cluster \(k\) we will compute the \(WGSS_k\) as:
$$WGSS_k = \sum_{i=1}^{n_k} ||X_{ik} – C_{k}||^2$$
where:
- \(n_k\) : the number of observations in cluster \(k\)
- \(X_{ik}\) : the \(i\)-th observation of cluster \(k\)
- \(C_k\) : the centroid of cluster \(k\)
And then sum all individual within group sums of squares:
$$WGSS = \sum_{k=1}^K WGSS_k$$
where:
- \(WGSS_k\) : the within group sum of squares of cluster \(k\)
- \(K\) : the number of clusters
Step 3: Calculate Calinski-Harabasz Index
The Calinski-Harabasz index is defined as the sum of inter-cluster dispersion and the sum of intra-cluster dispersion for all clusters.
The Calinski-Harabasz index is calculated as:
$$CH = \frac{\frac{BGSS}{K-1}}{\frac{WGSS}{N-K}} = \frac{BGSS}{WGSS} \times \frac{N-K}{K-1}$$
where:
- \(BGSS\) : between-group sum of squares (between-group dispersion)
- \(WGSS\) : within-group sum of squares (within-group dispersion)
- \(N\) : total number of observations
- \(K\) : total number of clusters
From the above formula, we can conclude that the large values of Calinski-Harabasz index represent better clustering.
Calinski-Harabasz Index Example in Python
In this section we will go through an example of calculating the Calinski-Harabasz index for a K-Means clustering algorithm in Python.
First, import the required dependencies:
from sklearn.datasets import load_iris
from sklearn.cluster import KMeans
from sklearn.metrics import calinski_harabasz_score
import matplotlib.pyplot as plt
You can use any data with the code below. For simplicity we will use the built in Iris dataset, specifically the first two features: “sepal width” and “sepal length”:
iris = load_iris()
X = iris.data[:, :2]
Let’s start with K-Means target of 3 clusters:
kmeans = KMeans(n_clusters=3, random_state=30)
labels = kmeans.fit_predict(X)
And check the Calinski-Harabasz index for the above results:
ch_index = calinski_harabasz_score(X, labels)

print(ch_index)
You should get the resulting score: 185.33266845949427 or approximately (185.33).
To put in perspective how the clusters look , let’s visualize them:
unique_labels = list(set(labels))
colors = ['red', 'orange', 'grey']

for i in unique_labels:
    filtered_label = X[labels == i]
    plt.scatter(filtered_label[:,0],
                filtered_label[:,1],
                color = colors[i],
                edgecolor='k')

plt.xlabel('Sepal length')
plt.ylabel('Sepal width')
plt.show()
We should see the following original 3 clusters:
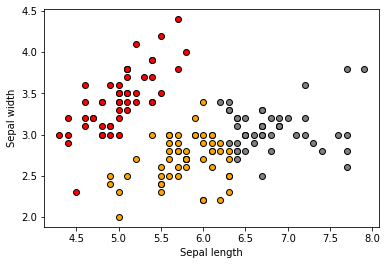
Since we computed the CH index for 3 clusters and the original data has 3 labels, we would assume that CH index is the highest for 3 clusters than any other number of clusters.
Let’s calculate the CH index for a range of numbers of clusters, and then find the highest values:
results = {}

for i in range(2,11):
    kmeans = KMeans(n_clusters=i, random_state=30)
    labels = kmeans.fit_predict(X)
    db_index = calinski_harabasz_score(X, labels)
    results.update({i: db_index})
and visualize it:
plt.plot(list(results.keys()), list(results.values()))
plt.xlabel("Number of clusters")
plt.ylabel("Calinski-Harabasz Index")
plt.show()
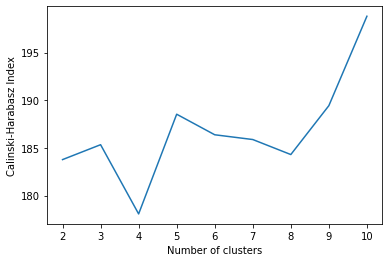
We find an interesting result that 5 clusters and 10 clusters provide a higher Calinski-Harabasz index value than 3 clusters (even though the actual number of labels in the data is 3).
Even though we can obtain higher CH index values for numbers of clusters other than 3, we can observe that the index values are still within a very close range between 175 and 200.
Conclusion
In this article we discussed how to calculate the Calinski-Harabasz index for clustering evaluation in Python using sklearn library.
Feel free to leave comments below if you have any questions or have suggestions for some edits and check out more of my Python Programming articles.