In this article we will explore how to standardize data in Python.
Table of Contents
- Introduction
- What is standardization
- Standardization example
- How to standardize data in Python
- Conclusion
Introduction
One of the first steps in feature engineering for many machine learning models is ensuring that the data is scaled properly.
Some models, such as linear regression, KNN, and SVM, for example, are heavily affected by features with different scales.
While others, such as decision trees, bagging, and boosting algorithms generally do not require any data scaling.
The level of effect of features’ scales on mentioned models is high, and features with larger ranges of values will play a bigger role in the decision making of the algorithm since impacts they produce have larger effect on the outputs.
In such cases, we turn to feature scaling to help us find common level for all these features to be evaluated equally when training the model.
Two most popular feature scaling techniques are:
- Z-Score Standardization
- Min-Max Normalization
In this article, we will discuss how to perform z-score standardization of data using Python.
To continue following this tutorial we will need the following two Python libraries: sklearn and pandas.
If you don’t have them installed, please open “Command Prompt” (on Windows) and install them using the following code:
pip install sklearn
pip install pandas
What is standardization
In statistics and machine learning, data standardization is a process of converting data to z-score values based on the mean and standard deviation of the data.
The resulting standardized value shows the number of standard deviations the raw value is away from the mean.
Basically each value of a given feature of a dataset will be converted to a representative number of standard deviations that it’s away from the mean of the feature.
This will allow us to compare multiple features together and get more relevant information since now all the data will be on the same scale.
The standardized data will have mean equal to 0 and the values will generally range between -3 and +3 (since 99.9% of the data is within 3 standard deviations from the mean assuming your data follows a normal distribution).
Let’s take a look at the z-score formula:
$$z_i = \frac{x_i – \bar{x}}{\sigma}$$
For each feature we will compute its mean and standard deviation. Then we will subtract the mean from each observation and divide it by standard deviation to get the standardized values.
Standardization example
In this section we will take a look at a simple example of data standardization.
Consider the following dataset with prices of different apples:
| Weight in g | Price in $ |
| 300 | 3 |
| 250 | 2 |
| 800 | 5 |
And plotting this dataset should look like this:
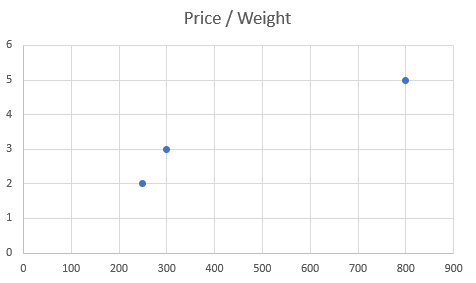
Here we see a much larger variation of the weight compare to price, but it appears to looks like this because of different scales of the data.
The prices range is between $2 and $5, whereas the weight range is between 250g and 800g.
Let’s standardize this data!
Start with the weight feature:
| Observation | \(x_i\) | \(z_i = \frac{x_i – \bar{x}}{\sigma}\) |
| 1 | 300 | \(\frac{300-450}{248.3277} = -0.6\) |
| 2 | 250 | \(\frac{250-450}{248.3277} = -0.81\) |
| 3 | 800 | \(\frac{250-450}{248.3277} = 1.41\) |
| Mean (\(\bar{x}\)) | 450 | |
| Standard Deviation (\(\sigma\)) | 248.3277 |
And do the same for the price feature:
| Observation | \(x_i\) | \(z_i = \frac{x_i – \bar{x}}{\sigma}\) |
| 1 | 3 | \(\frac{3-3.33}{1.25} = -0.264\) |
| 2 | 2 | \(\frac{2-3.33}{1.25} = -1.064\) |
| 3 | 5 | \(\frac{5-3.33}{1.25} = 1.336\) |
| Mean (\(\bar{x}\)) | 3.33 | |
| Standard Deviation (\(\sigma\)) | 1.25 |
And combine the two features into one dataset:
| Weight (standardized) | Price (standardized) |
| -0.6 | -0.264 |
| -0.81 | -1.064 |
| 1.41 | 1.336 |
We can now see that the scale of the features in the dataset is very similar, and when visualizing the data, the spread between the points will be smaller:
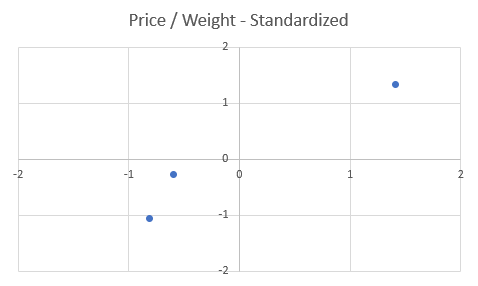
The graph looks almost identical with the only difference being the scale of the each axis.
Now let’s see how we can recreate this example using Python!
How to standardize data in Python
Let’s start by creating a dataframe that we used in the example above:
import pandas as pd

data = {'weight':[300, 250, 800],
        'price':[3, 2, 5]}

df = pd.DataFrame(data)

print(df)
And you should get:
   weight  price
0     300      3
1     250      2
2     800      5
Once we have the data ready, we can use the StandardScaler() class and its methods (from sklearn library) to standardize the data:
from sklearn.preprocessing import StandardScaler

scaler = StandardScaler()

standardized_data = scaler.fit_transform(df)

print(standardized_data)
And you should get:
[[-0.60404045 -0.26726124]
 [-0.80538727 -1.06904497]
 [ 1.40942772  1.33630621]]
As you can see, the above code returned an array, so the last step would be to convert it to dataframe:
standardized_df = pd.DataFrame(standardized_data, columns=df.columns)

print(standardized_df)
And you should get:
     weight     price
0 -0.604040 -0.267261
1 -0.805387 -1.069045
2  1.409428  1.336306
which is identical to the result in the example which we calculated manually.
Conclusion
In this tutorial we discussed how to standardize data in Python.
Feel free to leave comments below if you have any questions or have suggestions for some edits and check out more of my Machine Learning articles.