In this tutorial we will explore how to calculate kurtosis in Python.
Table of contents
- Introduction
- What is kurtosis?
- How to calculate kurtosis?
- How to calculate kurtosis in Python?
- Conclusion
Introduction
Kurtosis is mainly a measure of describing the shape of a probability distribution and specifically it’s “tailedness”.
The calculated statistic evaluates how thick or thin the tails of a given probability distribution are compared to the normal distribution.
Where skewness focuses on the differentiating the tails of the distribution based on the extreme values (or simply the symmetry of the tails), kurtosis measures whether there are extreme values in either of the tails (or simply if the tails are heavy or light).
To continue following this tutorial we will need the following Python library: scipy.
If you don’t have it installed, please open “Command Prompt” (on Windows) and install it using the following code:
pip install scipy
What is kurtosis?
In statistics, kurtosis is a measure of relative peakedness of a probability distribution, or alternatively how heavy or how light its tails are. A value of kurtosis describes how different the tails of a given probability distribution are from a normal distribution.
Kurtosis can take several values:
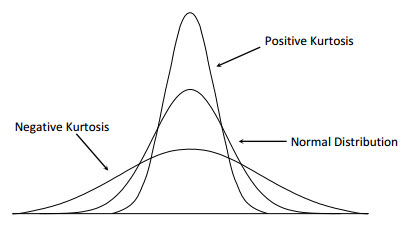
- Positive excess kurtosis – when excess kurtosis, given by (kurtosis – 3), is positive, then the distribution has a sharp peak and is called a leptokurtic distribution.
- Negative excess kurtosis – when excess kurtosis, given by (kurtosis – 3), is negative, then the distribution has a flat peak and is called a platykurtic distribution.
- Zero excess kurtosis – when excess kurtosis, given by (kurtosis – 3), is zero, then the distribution follows a normal distribution and is also called a mesokurtic distribution.
Here is a summary of what is mentioned above in a table format:
| Kurtosis | Excess Kurtosis | |
| Leptokurtic | >3 | >0 |
| Platykurtic | <3 | <0 |
| Mesokurtic | =3 | =0 |
How to calculate kurtosis?
The measure of kurtosis is calculated as the fourth standardized moment of a distribution.
Sounds a bit complicated? Follow the next steps to have a complete understanding of the calculations.
The \(k^{th}\) moment of the distribution can be calculated as:
$$\widetilde{\mu}_{k} = \frac{\mu_{k}}{\sigma_{k}} = \frac{E[(X-\mu)^k]}{(E[(X-\mu)^2])^{\frac{k}{2}}}$$
As mentioned before, skewness is the fourth moment of the distribution and can be calculated as:
$$K = \frac{m_4}{(m_2)^\frac{4}{2}} = \frac{m_4}{(m_2)^2}$$
and knowing that the second moment of the distribution is its variance, we can simplify the above equation to:
$$K = \frac{m_4}{(\sigma^2)^2}$$
where:
$$m_k = \frac{1}{N} \sum_{n=1}^{N}(x_n – \bar{x})^k$$
Example:
It is a lot of formulas above. To make it all into a better understandable concept let’s take a look at an example!
Consider the following sequence of 10 numbers that represent students’ grades on a test:
\(X\) = [55, 78, 65, 98, 97, 60, 67, 65, 83, 65]
Calculating the mean of X we get: \(\bar{x}=73.3\).
Solving for \(m_4\):
$$m_4 = \frac{1}{10}\sum_{n=1}^{10}(x_n – \bar{x})^4$$
$$m_4 = \frac{(55-73.3)^4 – (78-73.3)^4 – … – (65-73.3)^4}{10} = 85,630.5$$
Solving for \(m_2\):
$$m_2 = \frac{1}{10}\sum_{n=1}^{10}(x_n – \bar{x})^2$$
$$m_2 = \frac{(55-73.3)^2 – (78-73.3)^2 – … – (65-73.3)^2}{10} = 204.61$$
Solving for \(K\):
$$K = \frac{m_4}{(m_2)^\frac{4}{2}} = \frac{85,630.5}{(204.61)^{2}} = 2.045373$$
How to calculate kurtosis in Python?
In this section we will go through an example of calculating kurtosis in Python.
First, let’s create a list of numbers like the one in the previous part:
x = [55, 78, 65, 98, 97, 60, 67, 65, 83, 65]
To calculate the Fisher-Pearson correlation of skewness, we will need the scipy.stats.kurtosis function:
from scipy.stats import kurtosis
print(kurtosis(x, fisher=False))
And we should get:
2.0453729382893178Note: setting fisher=False in the above code does the calculation of the Pearson’s definition of kurtosis where the kurtosis value for normal distribution = 3.
We find that for the given sequence of numbers the value of kurtosis is around 2.05 and the value of excess kurtosis is around -0.95. This shows that we have a distribution with thicker tails and flatter than the normal distribution.
Conclusion
In this article we discussed how to calculate kurtosis for a set of numbers in Python using scipy library.
Feel free to leave comments below if you have any questions or have suggestions for some edits and check out more of my Statistics articles.