In this article we will explore how to profile Python code with cProfile module.
Table of Contents
- Introduction
- What is code profiling?
- cProfile basic usage
- Profile Python code with cProfile from terminal
- Profile Python code with cProfile in Python
- Profile Python functions with cProfile in Python
- Export cProfile data
- Conclusion
Introduction
Today programmers write thousands of lines of code in a matter of days. The complexity of new programs and applications evolves constantly and the code bases include multiple functions, some of which can slow down the performance of the entire program.
Focusing on code profiling, and specifically profiling your Python code to identify bottlenecks in the performance can significantly increase the performance of the software as well as create a better user experience.
In this tutorial we will work with the Python built-in cProfile module which provides deterministic profiling of Python programs.
What is code profiling?
Code profiling is the process of analyzing the performance of programs, specifically analyzing performance of the code to identify potential bottlenecks.
Identifying which parts of code run slow and then optimizing this code can significantly improve performance of the software, decrease memory usage and resource consumption.
In Python, cProfile profiling tool allows to track the execution time and memory usage of your Python scripts, helping identify slow-performing and high resource consuming parts of the code.
cProfile basic usage
Here is a quick example of profiling with cProfile and interpretation of the output:
import cProfile
import re

cProfile.run("re.compile('Python')")
You should get:
Python
         4 function calls in 0.000 seconds

   Ordered by: standard name

   ncalls  tottime  percall  cumtime  percall filename:lineno(function)
        1    0.000    0.000    0.000    0.000 :1()
        1    0.000    0.000    0.000    0.000 {built-in method builtins.exec}
        1    0.000    0.000    0.000    0.000 {built-in method builtins.print}
        1    0.000    0.000    0.000    0.000 {method 'disable' of '_lsprof.Profiler' objects}
Now let’s interpret the output:
- ncalls – the number of calls
- tottime – the total time spent in a given function
- percall – the ratio of tottime and ncalls
- cumtime – the cumulative time spent in current function and subfunctions
- percall – the ratio of cumtime and primitive calls
- filename – the data of each function
Profile Python code with cProfile from terminal
Before we get started with Python code profiling, we will need some sample Python code to work with.
Let’s create a simple script that will print “Python Programming” 5 times and call it main.py:
i=0
for i in range(5):
    print('Python Programming')
    i+=1
and once you run it, you should get:
Python Programming
Python Programming
Python Programming
Python Programming
Python Programming
One of the easiest ways to profile your Python code with cProfile is to run cProfile from terminal.
Open the terminal and navigate to the folder where your Python script (main.py) is located, and run:
python -m cProfile main.py
You should get:
Python Programming
Python Programming
Python Programming
Python Programming
Python Programming
         8 function calls in 0.001 seconds

   Ordered by: standard name

   ncalls  tottime  percall  cumtime  percall filename:lineno(function)
        1    0.000    0.000    0.001    0.001 main.py:1()
        1    0.000    0.000    0.001    0.001 {built-in method builtins.exec}
        5    0.001    0.000    0.001    0.000 {built-in method builtins.print}
        1    0.000    0.000    0.000    0.000 {method 'disable' of '_lsprof.Profiler' objects}
Profile Python code with cProfile in Python
Another way of profiling your Python code with cProfile is by using cProfile module directly in your Python script.
You will need to import the cProfile module into your Python environment and explicitly call the profiling function while passing the Python code as a string into the function as an argument:
import cProfile

cProfile.run("print('Python Programming')")
You should get:
Python Programming
         4 function calls in 0.000 seconds

   Ordered by: standard name

   ncalls  tottime  percall  cumtime  percall filename:lineno(function)
        1    0.000    0.000    0.000    0.000 :1()
        1    0.000    0.000    0.000    0.000 {built-in method builtins.exec}
        1    0.000    0.000    0.000    0.000 {built-in method builtins.print}
        1    0.000    0.000    0.000    0.000 {method 'disable' of '_lsprof.Profiler' objects}
In this example, we simplified the code to just one line of printing “Python Programming”, because as you can see, passing code into cProfile.run() as a string is not the most convenient option.
There should be a better way right? Of course! In the next section we will explore how to profile Python code using functions and cProfile.
Profile Python functions with cProfile in Python
Let’s reuse the Python code from one of the previous sections and now place it in a function my_func():
def my_func():
    i=0
    for i in range(5):
        print('Python Programming')
        i+=1
Now we can easily run a profiler on this function by passing it into cProfile.run() as an argument:
import cProfile

def my_func():
    i=0
    for i in range(5):
        print('Python Programming')
        i+=1

cProfile.run('my_func()')
and you should get:
Python Programming
Python Programming
Python Programming
Python Programming
Python Programming
         9 function calls in 0.001 seconds

   Ordered by: standard name

   ncalls  tottime  percall  cumtime  percall filename:lineno(function)
        1    0.000    0.000    0.001    0.001 :1()
        1    0.000    0.000    0.001    0.001 main.py:3(my_func)
        1    0.000    0.000    0.001    0.001 {built-in method builtins.exec}
        5    0.001    0.000    0.001    0.000 {built-in method builtins.print}
        1    0.000    0.000    0.000    0.000 {method 'disable' of '_lsprof.Profiler' objects}
Export cProfile data
In the previous sections we ran the profiler on the Python code and the results were printed out in terminal.
But can we extract and save the profiling data?
Yes! Using the built-in pstats module together with cProfile we can extract and save the profiler results in a simple .txt file.
Notice that the profile.run() functionality is defined as:
profile.run(command, filename=None, sort=- 1)where when filename is set to None, it automatically prints out the profiling report.
Let’s now set filename equal to some sample file name like ‘results’ and run the code from the previous section:
import cProfile

def my_func():
    i=0
    for i in range(5):
        print('Python Programming')
        i+=1

cProfile.run('my_func()', 'results')
You will notice the output in terminal is simply what the function is supposed to generate, but no profiling report:
Python Programming
Python Programming
Python Programming
Python Programming
Python Programming
However, you will now have a new file ‘results’ created in the directory of the project:

We have the file with the profiling report, but we can’t open it just yet. Now we will need to convert it into .txt file using the pstats module, and then the report can be accessed.
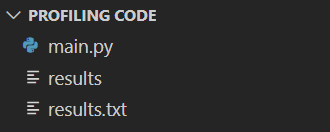
This additional code will convert the ‘results’ file into ‘results.txt’:
import pstats

with open('results.txt', 'w') as file:
    profile = pstats.Stats('results', stream=file)
    profile.print_stats()
    file.close()
and you should see a new file in the directory:

Now we have successfully created a .txt file with the profiling report. It should contain the following data:

Complete Code for Extracting cProfile data
import cProfile
import pstats

def my_func():
    i=0
    for i in range(5):
        print('Python Programming')
        i+=1

cProfile.run('my_func()', 'results')

with open('results.txt', 'w') as file:
    profile = pstats.Stats('results', stream=file)
    profile.print_stats()
    file.close()
Conclusion
In this article we explored how to profile Python code with cProfile module.
Code profiling helps identify bottlenecks in the code and helps understand which parts of the code should be optimized for better overall performance.
Feel free to leave comments below if you have any questions or have suggestions for some edits and check out more of my Python Programming tutorials.
